

Your numbers.
A clear view.
Better decisions.
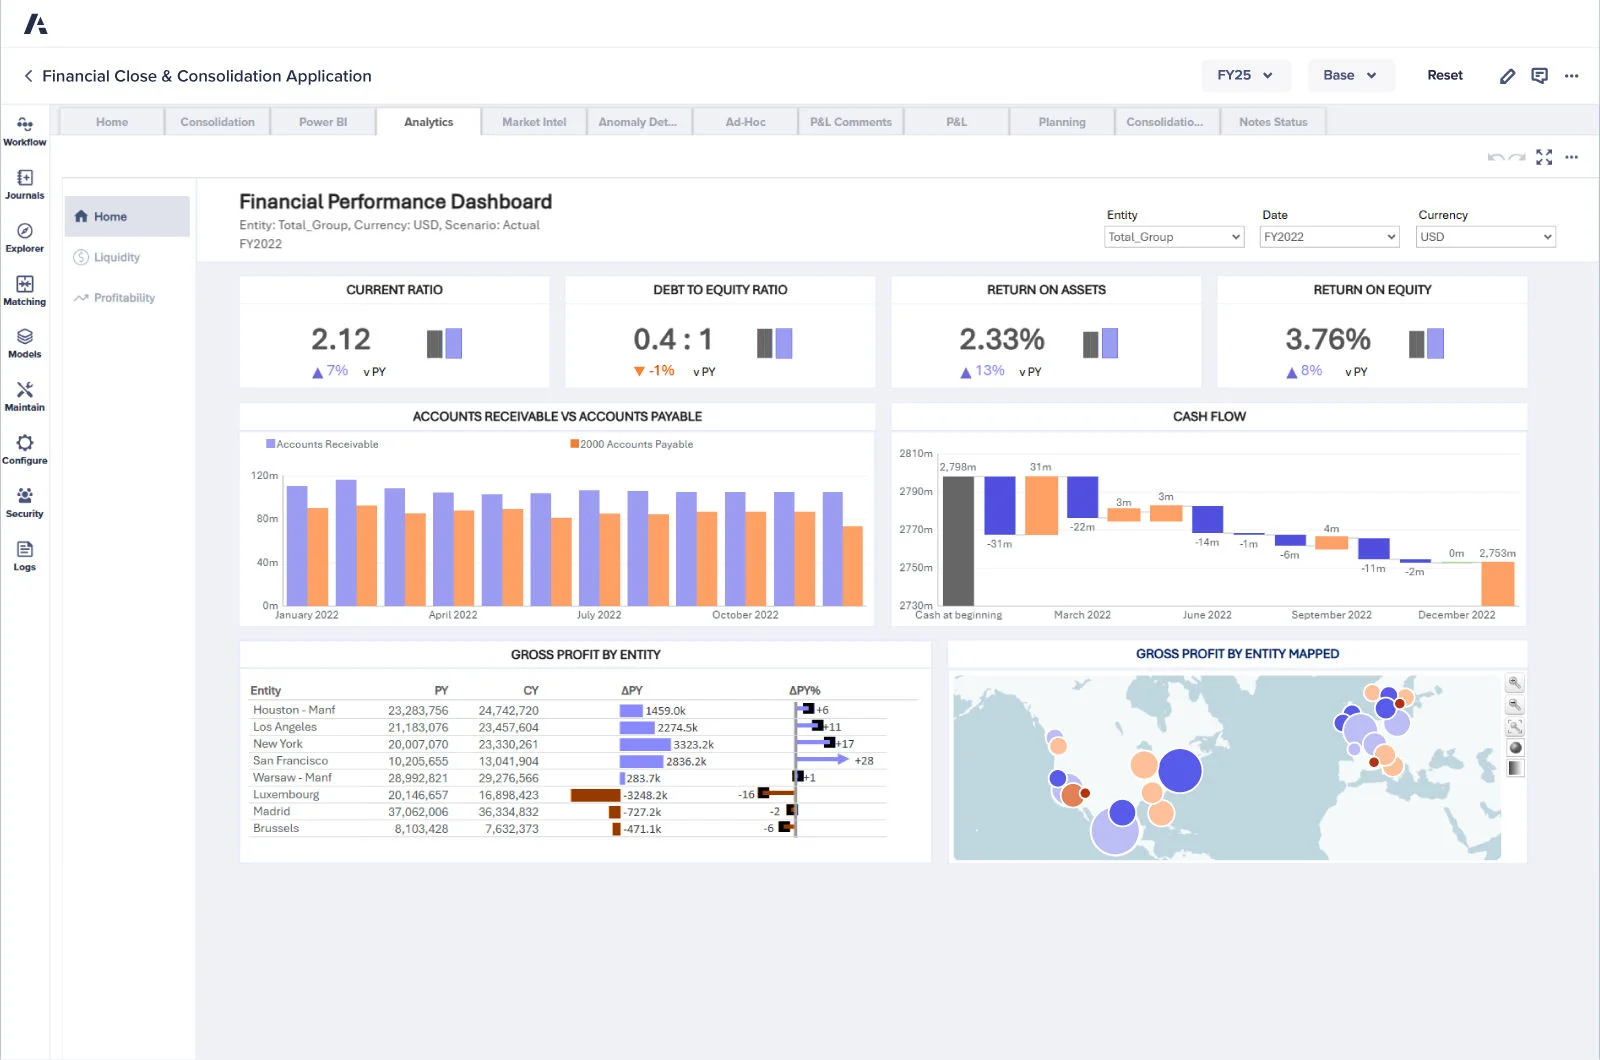
Connect your financial data to your decisions. Calisto Consulting designs reports and dashboards that make sense of your group’s performance.
Fictional data for illustration. This visual does not show any client’s results.
Shared definitions, validated data.
Less rework, more time for analysis.
A shared view, from Group to operations.
Understand performance
at every level.
We work with your teams to build the reporting needed for each decision, from monthly reporting to strategic reviews.
A consistent view
of your results.
Structure your income statement, balance sheet and cash flows. Analyse actuals, budgets and comparable periods within a common framework.
The essentials, visible
at a glance.
Give executive and finance teams a clear overview. Drill down from a Group KPI to an entity, business line or country.
Anticipate.
Then adjust.
Connect reporting to your FP&A processes. Compare scenarios, update forecasts and highlight variances that require action.
Understand what
makes the difference.
Define the indicators that matter to your business. Break down margins, monitor cash and connect financial data to operational drivers.
From data to decisions.
Confidence at every step.
Dashboard quality starts long before its design. We support the entire reporting process.
Start with decisions
Identify users, indicators, analysis dimensions and reporting cycles.
Align data
Organise sources, mappings, controls and information traceability.
Build and test
Configure reports, automate flows and validate results with your teams.
Embed new practices
Train users, document models and support ongoing improvements.
The right tools.
One unified view.
We connect your consolidation, planning and visualisation solutions around your reporting needs. Tool selection fits your architecture and working practices.
 FCR & XL reporting
 Consolidation & reporting
 Performance & planning
 BFC & Group reporting
 Consolidation & performance
Your reporting,
in practice.
A framework built around your teams, data and decisions.
Do we need to replace all our tools?
Not necessarily. We start with your existing environment and challenges. The assignment may focus on improving a model’s reliability, automating reporting or implementing a new solution.
Can reporting, budgeting and consolidation be connected?
Yes, by mapping accounts, entities, periods and analysis dimensions. We clarify reconciliation rules to explain differences between financial views.
How can indicator reliability be ensured?
Each KPI needs a definition, source, owner and documented calculation rules. Consistency checks and user validation complete the framework before go-live.
Do you support teams after deployment?
We provide training, support and ongoing enhancements to support adoption and adapt reporting as your organisation evolves. We agree the scope with you based on your needs.
Let your data tell the story.
Share your reporting challenges. Let’s build a view that supports your performance.